

Audit Log Configuration
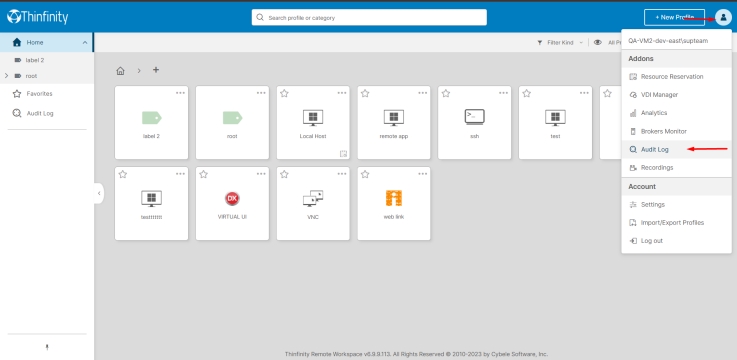
To access the Audit Logs from the Thinfinity® Workspace home page you need to go to your user icon and then click on Audit Log.
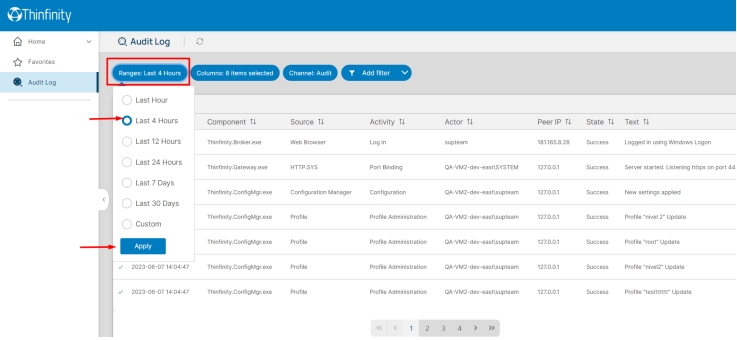
Once you are under the Audit Log tab, you will be able to Filter the information in many ways.
• You can filter it by ranges, where you can select the activity by time as desired.
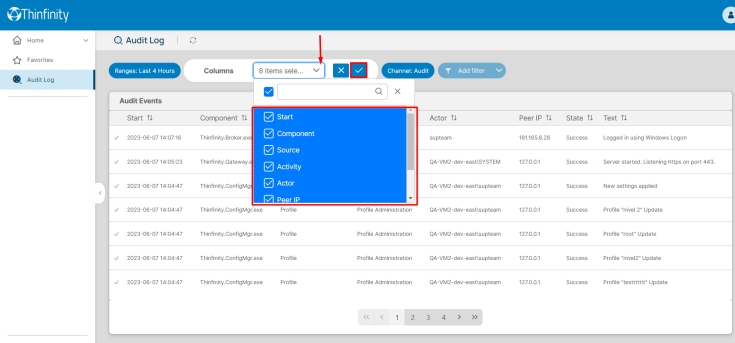
• You can modify the columns of the table that you would like to have.
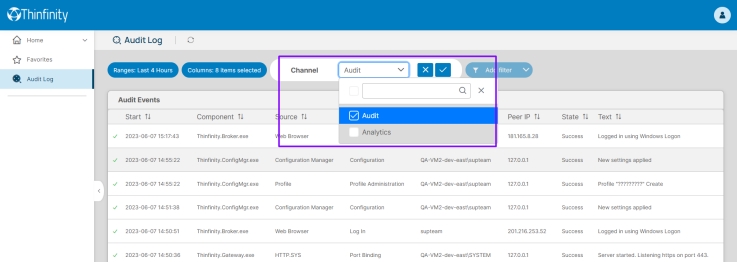
• You can filter by channel
• You can customize filters and combine them in many ways.
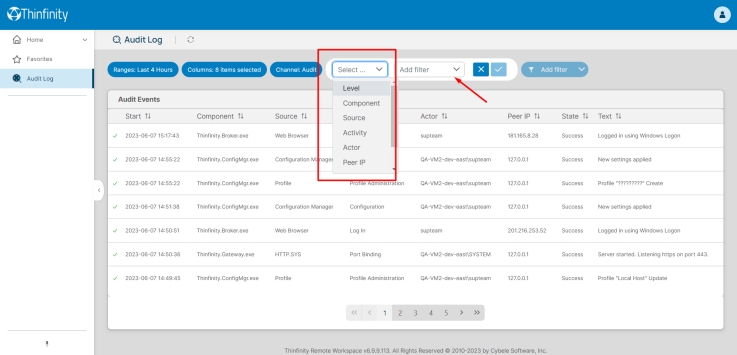
Below you will find details about the filters you can apply.
• You can customize filters and combine them in many ways.
• Filter by Text, Peer IP, and Actor
OK
Warning
Error
Processes
And
or
DLL
Authentication
Methods
Broker
Web Server
Client Session
RDP Connector
VUI Connector
Web VPN Connector
Gateway
Web Browser
Launcher
License
Login
Logout
Navigation
Profile
Remote AD
Rest API
Server
Service
Service Manager
Configuration Manager
Web Sockets
Web Dav
IP Security
Log In
Log Out
Port Binding
Configuration
Blacklisting
External Change
Parameter Settings
Password Change
Initial
Progress
Success
Failed
Created
Changed
Updated
Deleted
Closed
Idle
Resolving
Connecting
Access
Granted
Retrying
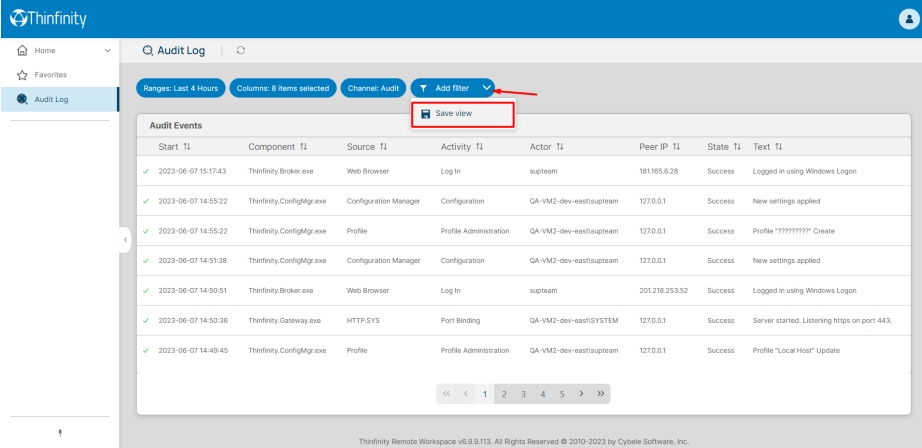
• You can save your view to have it ready for future audits.
Was this helpful?